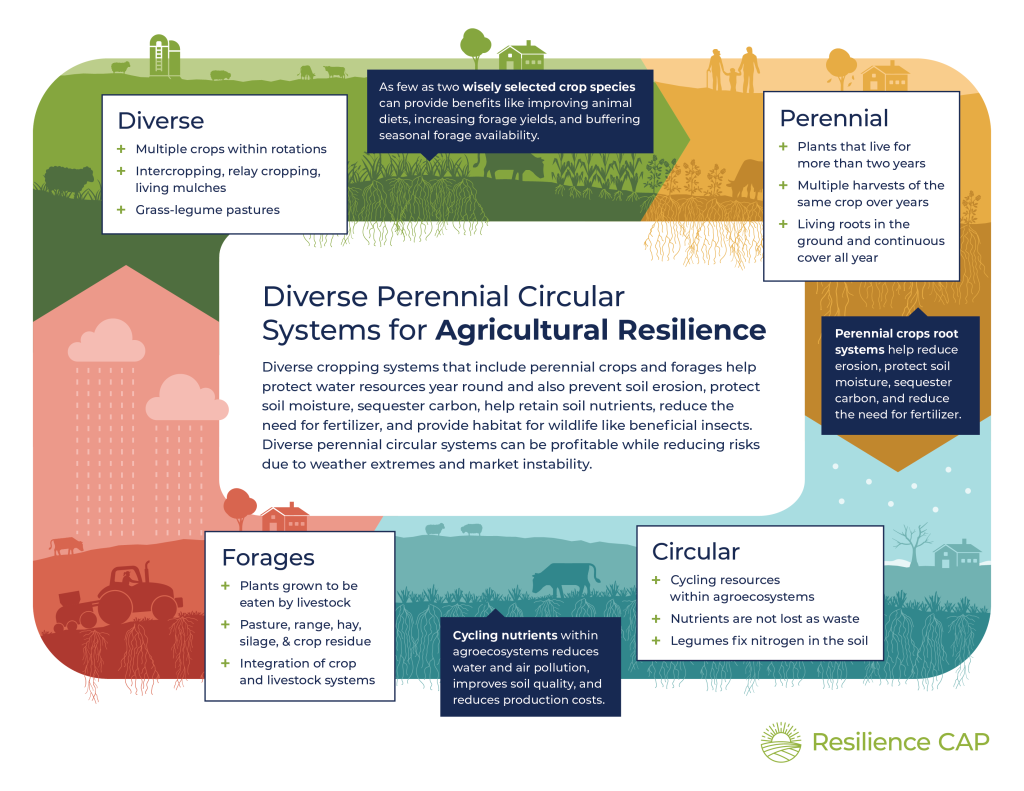
AG-RESILIENCE

Our goal is to create a more resilient agricultural system. Resilient agriculture is a system of agriculture that can rebound from extreme weather events, economic downfalls, or other short- or long-termed stressors—overall, maintaining farm resources and profitability.

Photo Credit: Shelby Gruss

Ag-Resilience

Impacts on Agriculture

Agriculture production systems have more pressure from extreme weather events, increasing input costs, and increasing world populations. Even though there is more pressure, agricultural systems are expected to perform at peak performance. The graph below depicts production expenses from the last 9 years, with a sharp increase in 2022.

Graph showing the production expenses for farming operations across the US from 2013 to 2022 broken into nine categories. Data used to create the graph can be found at: https://data.ers.usda.gov/reports.aspx?ID=17834
Flooded corn field after weeks of rain. Photo Credit: Kim Cassida

Identification of best resilient practices will be invaluable to farmers as they implement new practices to shield production against weather extremes and market instability.

Drought has plagued many parts of the US the past years. To check your current drought levels check the US Drought Monitor hosted through University Nebraska Lincoln with the National Drought Mitigation.

Corn leaves rolling due to being under severe drought stress.
Corn leaves rolled by drought. Photo Credit: Kim Cassida.
The figure depicts billion dollar weather events in 2022 for NOAA. These events have a large impact on agriculture production. NOAA National Centers for Environmental Information (NCEI) U.S. Billion-Dollar Weather and Climate Disasters (2023). https://www.ncei.noaa.gov/access/billions/, DOI: 10.25921/stkw-7w73

Through farmer participation, our goals of the project are to identify resilient practices, use this information to inform farmers, and inform policy to overall support implementation of these practices to be able to weather the unexpected weather events to come. An example of large weather events from 2022 are shown in the figure labeled “U.S. 2022 Billion-Dollar Weather and Climate Disasters”. A visual depiction of a resilient system is below.

A) Depicts a system with normal events occuring. The system fluctuates around average capacity. B) Depicts an extreme event occured. The blue line shows how a resilient system recovers to average capacity quickly, where the orange line shows a system with poor resiliency has a struggle to recover to original capacity. Add Hay and forage citation

Would you like to learn more about our project?

Meet our collaborators

Highlights of the Month

Join our Farm Network to help determine what factors make an agricultural operation resilient! We are recruiting farmers from across the US. To learn more about this opportunity go to our farmer’s project page. Below is a poster highlighting recruiting efforts at the American Forage and Grassland Council annual meeting! We hope to hear from you and more about your operation.

This work is supported by AFRI Sustainable Agricultural Systems Coordinated Agricultural Project (SAS-CAP) grant no. 2021-68012-35917 from the USDA National Institute of Food and Agriculture.